How I Audited My Next.js App: A Technical Audit Using PageSpeed Insights, Chrome Lighthouse, and Next.js Bundle Analysis
Introduction
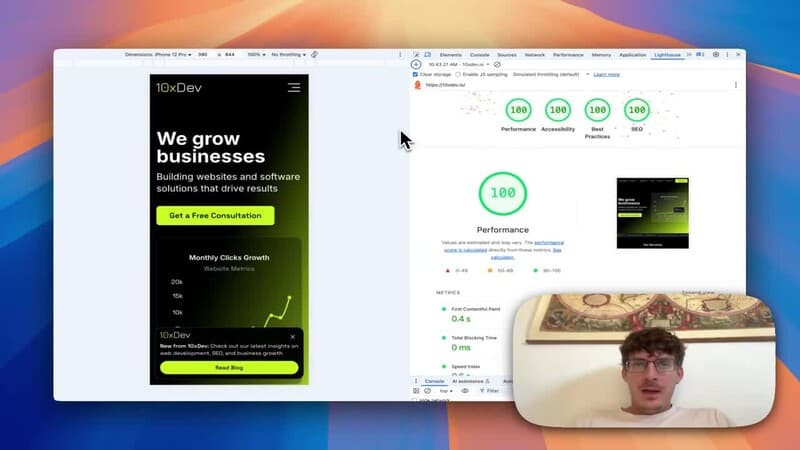
I recently ran a Lighthouse audit on a production Next.js site and was greeted with confetti and a perfect score across the board. That feels great, but it can also be misleading. Lab audits like Lighthouse are useful for finding obvious optimization opportunities, but they do not always represent real user conditions.
In this post I show why you should also run field audits, how to interpret PageSpeed Insights results, and how to use a bundle analyzer to find the JavaScript that is inflating your client bundle.
Lab audits versus field audits
Lighthouse is an excellent tool for identifying issues under controlled conditions. Learn more about how Lighthouse works on the official docs: Lighthouse overview.
However, Lighthouse runs in a lab environment where network conditions and hardware are simulated at relatively strong levels. To see how your site performs for real users, use a field audit such as Google PageSpeed Insights, which runs tests from Google servers and simulates slower mobile networks: PageSpeed Insights.
When I moved my tests to PageSpeed Insights, my score fell from perfect to around 76. That difference is often caused by shipping too much JavaScript to client devices on slow networks.
Why the scores differ
PageSpeed Insights uses real-world signals and throttles the network and CPU to better approximate user devices around the globe. Your development connection, geographic proximity to your hosting, and local network quality are usually much better than those of a typical mobile user.
Because of that, a bundle that appears fast in Lighthouse can be slow on PageSpeed Insights. Field audits reveal issues that matter for actual users, such as long parse and execution times on low-end devices.
Use a bundle analyzer to see what you ship
Next.js and the larger JavaScript ecosystem make it easy to chunk and ship only the code that a page needs. But it is still possible to accidentally send large libraries to the client.
To inspect what you are shipping, use a bundle analyzer to visualize chunks and module sizes. I'm using the @next/bundle-analyzer package from Vercel: @next/bundle-analyzer.
When I ran the analyzer on my app, the visualization showed a nearly whole-megabyte chunk associated with a chart library. That immediately pointed to the largest offender.
Understanding size metrics: uncompressed, parsed, gzipped
When inspecting bundle sizes in an analyzer, you will see a few different metrics:
- Uncompressed size: the file size before network compression. Useful for understanding the true weight of the module.
- Gzipped size: the compressed size that is sent over the wire. This is typically smaller and is what affects network transfer time.
- Parsed or parsed+executed size: the size after the browser decompresses the code and parses it for execution. This affects CPU and the time to become interactive, particularly on mobile devices.
In my case the chart chunk was almost 1 MB uncompressed, about 325 KB when decompressed for parsing, and a smaller gzipped size when transferred. Even with good compression, the parse and execution cost on a slow device was enough to tank the PageSpeed score.
Actionable steps to reduce client bundle size
Here are practical steps I took and recommend when you identify a heavy chunk:
- Code-split the heavy component so it is only loaded on pages that need it. Next.js supports dynamic imports to lazy-load components.
- Replace large libraries with smaller alternatives or tree-shakeable builds. Sometimes a lighter charting library or a custom SVG solution can deliver similar UX for much less code.
- Server-side render or statically render components that do not need client-side JavaScript.
- Use dynamic imports with SSR disabled for client-only features so they do not block server-rendered page delivery.
- Audit transitive dependencies; sometimes a small usage pulls in a large dependency graph.
Implementing these changes and re-testing with PageSpeed Insights typically yields a noticeable improvement in the field score.
Quick checklist for a Next.js technical audit
- Run a Lighthouse lab audit for obvious issues. Lighthouse overview
- Run a PageSpeed Insights field audit for real-world performance. PageSpeed Insights
- Generate a bundle report and inspect large chunks. @next/bundle-analyzer
- Identify the heaviest modules and decide whether to defer, replace, or tree-shake them
- Re-run field audits after changes to verify improvements
Conclusion
Lab tools give you fast feedback and help surface quick wins, but field audits show how your site performs for real users. Using a bundle analyzer in conjunction with PageSpeed Insights allowed me to identify a large charting library as the primary cause of a lower field score and prioritize fixes that will improve performance for mobile users. If you are interested in a technical audit of your Next.js site, let's talk.
References